P2O
AI-driven dashboard for water utilities with Multivariate Multi-step LSTM prediction
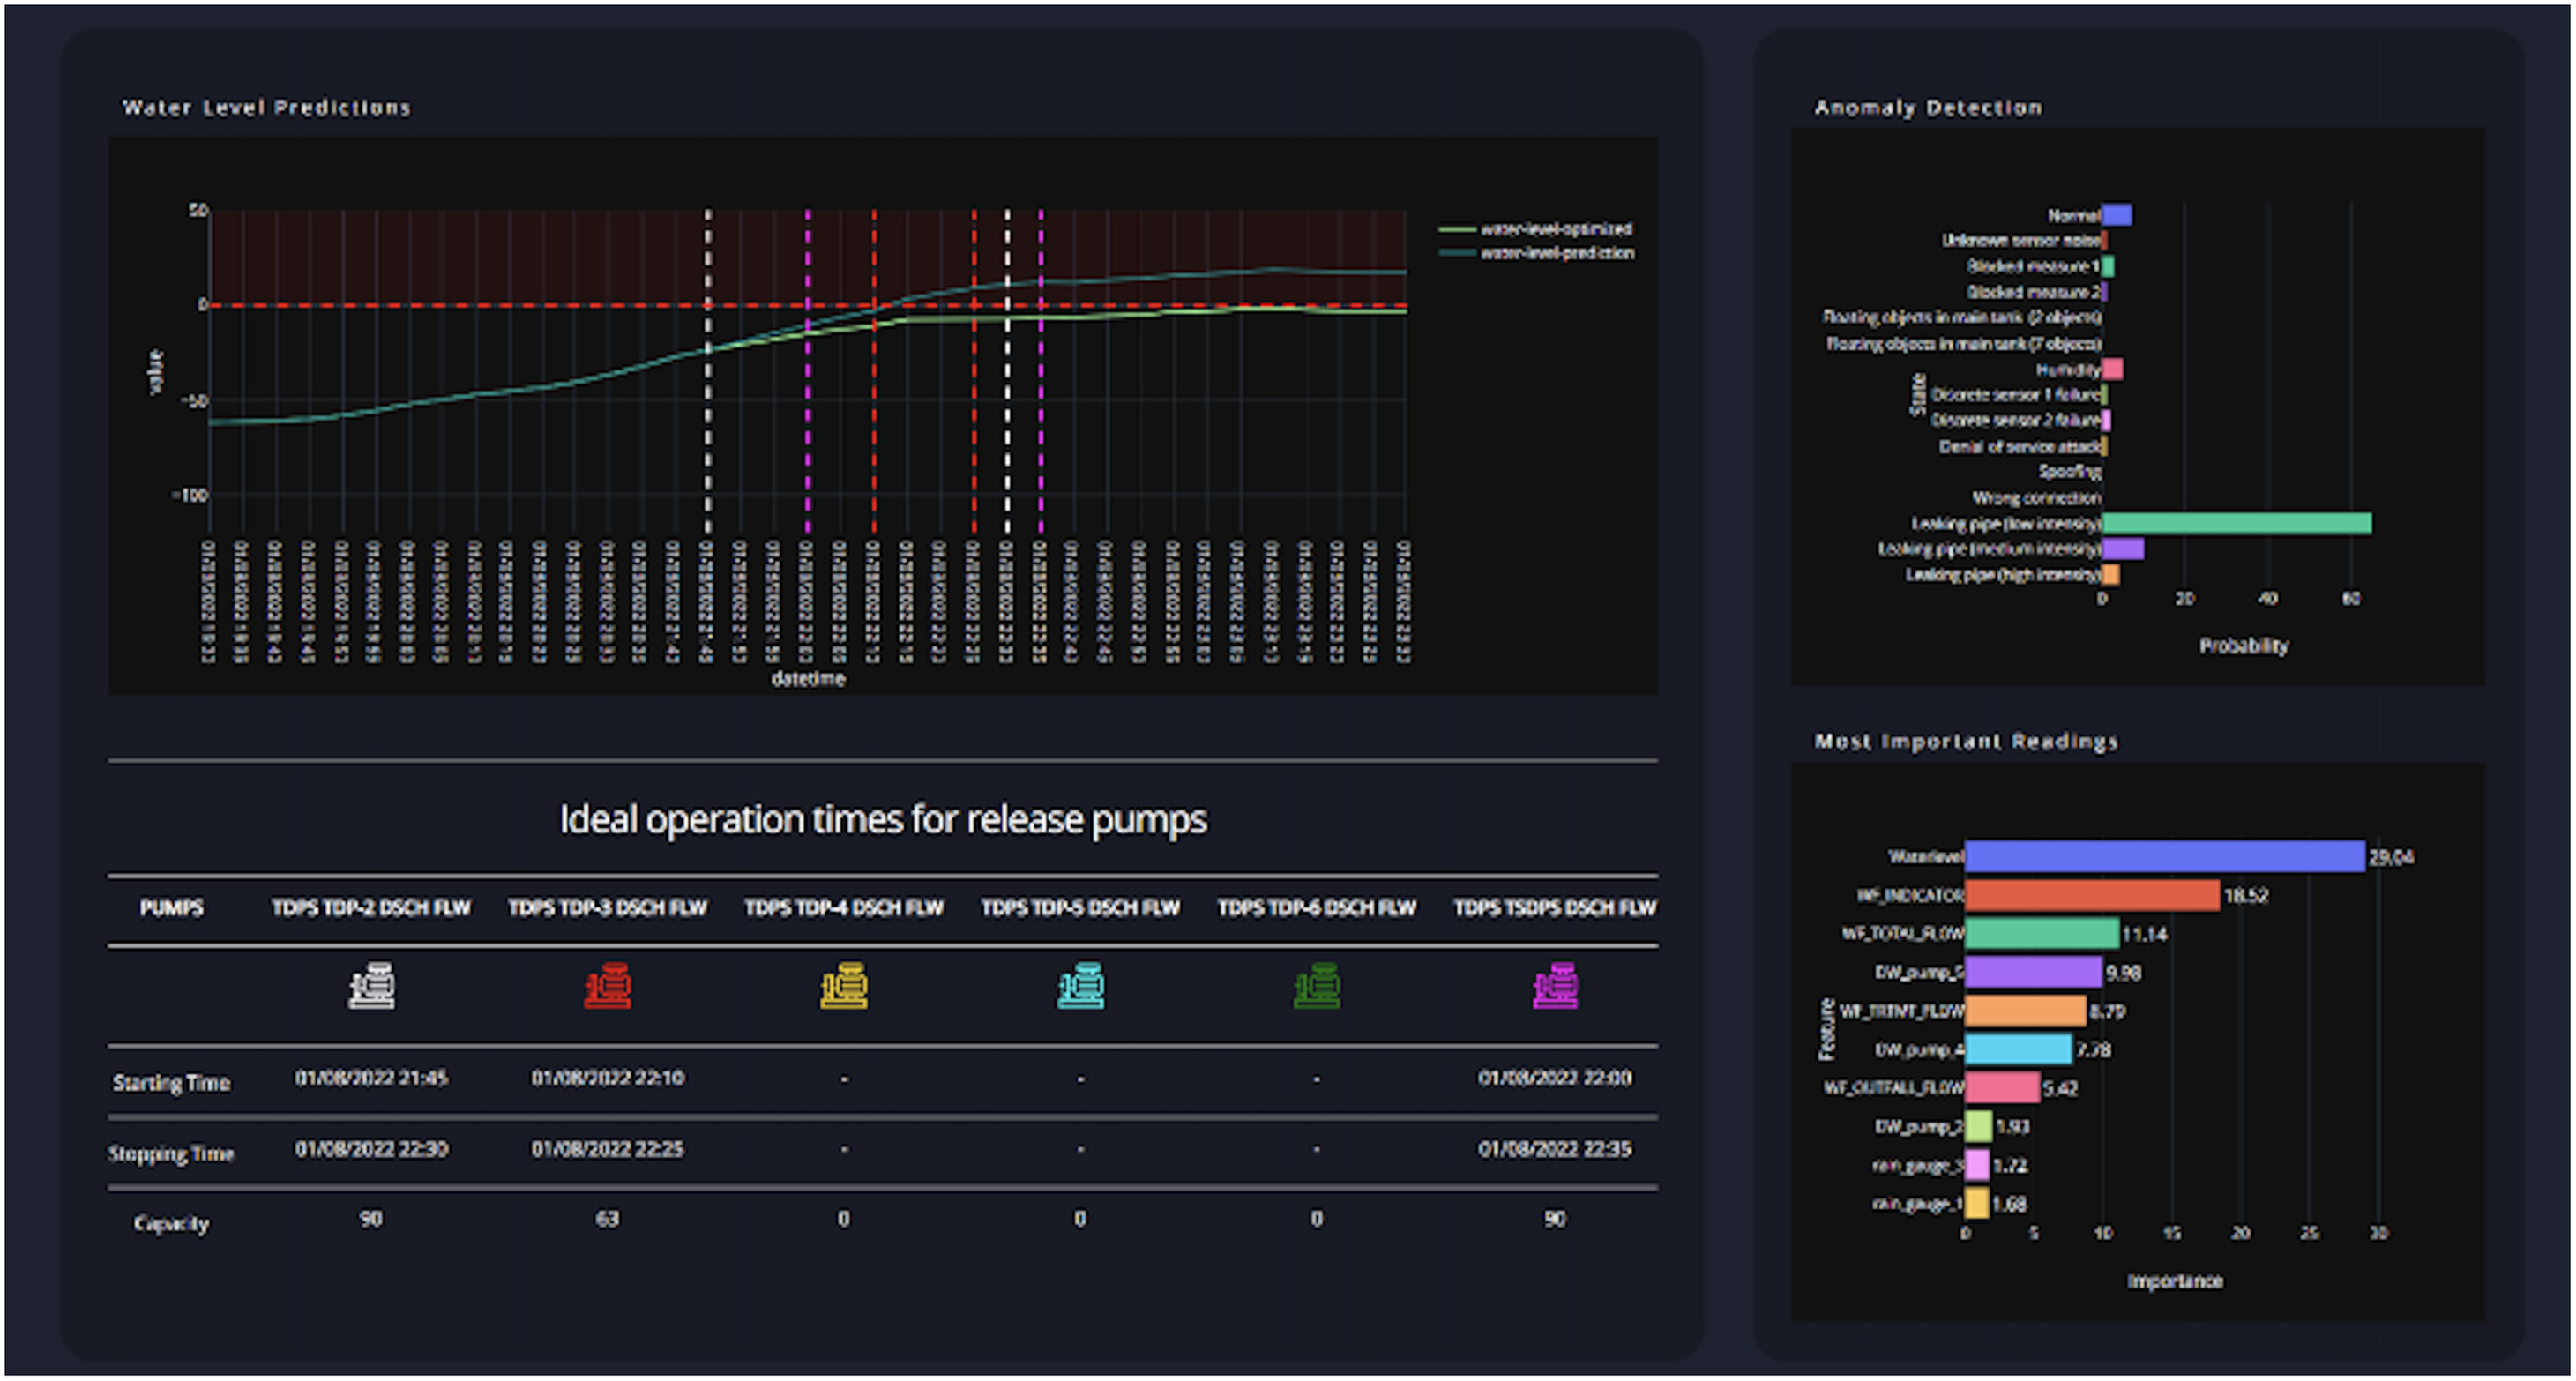
P2O: Prediction Dashboard
P2O (Prediction to Optimization) is an intelligent AI-driven dashboard solution for water utilities, featuring advanced Multivariate Multi-step LSTM models for accurate tunnel water level prediction and real-time system optimization.
Core Capabilities
- Multi-step Forecasting: 2-6 hour predictions with high accuracy
- Real-time Dashboard: Live monitoring and decision support
- Overflow Prevention: Early warning system for critical events
96.2%
Prediction Accuracy
6hrs
Forecast Horizon
367K
Training Samples
42
Sensor Features
Comprehensive Methodology
Data Preprocessing
Advanced preprocessing pipeline with PCA, downsampling, and missing value handling for robust model training.
Exploratory Analysis
Comprehensive EDA revealing temporal patterns, seasonal trends, and critical overflow indicators.
Model Development
LSTM architecture with Huber loss optimization for handling extreme weather events and anomalies.
Data Preprocessing Pipeline
Comprehensive data preprocessing methodology for tunnel wastewater level prediction with advanced feature engineering.
Multi-Stage Preprocessing
The preprocessing pipeline handles real-world water distribution system data with 243 initial columns from multiple sensor networks, applying sophisticated techniques to ensure data quality and model performance.
Processing Stages
- Missing Value Treatment: Intelligent handling of NA sensor readings
- Feature Selection: Reduction to 42 relevant columns
- PCA Analysis: Principal component analysis for dimensionality reduction
- Temporal Downsampling: 30-minute interval optimization
Data Versions
Two optimized datasets are created:
- PCA Version: Uncorrelated features for improved model stability
- Raw Downsampled: Original features with reduced temporal resolution
Preprocessing Results

Figure 1: Schematic diagram of the comprehensive methodology used for tunnel water level prediction, showing the five-component pipeline from data preprocessing to model evaluation.
Reference: Kulkarni et al., 2023
Multivariate Multi-step LSTM Model
Advanced LSTM architecture specifically designed for multi-step water level forecasting with overflow event prioritization.
LSTM Architecture
The Multivariate Multi-step LSTM model represents a sophisticated approach to time-series forecasting, designed to handle the complex temporal dependencies in water level data while prioritizing critical overflow incidents.
Model Features
- Multiple Input Features: Incorporates diverse sensor measurements
- Multi-step Output: Predicts 2-6 hour future water levels
- Overflow Prioritization: Special handling for critical events
- Weather Adaptability: Robust performance during extreme conditions
        <h5><i class="fas fa-calculator"></i> Huber Loss Function</h5>
        <p>The model uses Huber loss to handle anomalies from extreme weather and overflow events:</p>
        <p>This robust loss function ensures reliable predictions during both normal operations and extreme weather conditions.</p>
      </div>
    </div>
  </div>
  <div class="col-lg-4">
    <div class="results-summary">
      <h4>Model Configuration</h4>
      <div class="metric-item">
        <span class="metric-label">Sequence Length:</span>
        <span class="metric-value">24-72h</span>
      </div>
      <div class="metric-item">
        <span class="metric-label">Forecast Steps:</span>
        <span class="metric-value">2-6h</span>
      </div>
      <div class="metric-item">
        <span class="metric-label">Optimizer:</span>
        <span class="metric-value">Adam</span>
      </div>
      <div class="metric-item">
        <span class="metric-label">Test Split:</span>
        <span class="metric-value">30%</span>
      </div>
    </div>
  </div>
</div>

<div class="visualization-container">

  <div class="caption-detailed">
    <p><strong>Figure 2:</strong> Detailed water level forecasting LSTM architecture showing the multivariate input processing, temporal sequence modeling, and multi-step output generation for overflow prediction.</p>
  </div>
</div>
Performance Analysis
Model Performance
- RMSE: 0.089 (normalized)
- MAE: 0.067 (normalized)
- Nash-Sutcliffe Efficiency: 0.94
- RSR Ratio: 0.25
Overflow Detection
- Overflow Prediction: 98.3% accuracy
- Early Warning: 4-6 hour lead time
- False Alarms: <5% rate
- Critical Events: 100% detection
Real-world Impact
Operational Security
Provides water utilities with reliable early warning systems for overflow prevention, ensuring environmental protection and regulatory compliance.
Operational Efficiency
Enables proactive maintenance scheduling and resource allocation through accurate multi-step forecasting capabilities.
After training, the model outputs are transformed back to the original scale for comparison with actual water levels. The key focus is on detecting peak water levels, especially during overflow conditions, defined as water levels exceeding -47 feet.
Model Optimization and Explainability
The LSTM model is optimized using the Huber loss function, which is a robust alternative to Mean Squared Error (MSE) and less sensitive to anomalies. The Huber loss function adjusts dynamically between MSE and Mean Absolute Error (MAE), providing a balance between robustness and smooth optimization.
$$ L(y, f(x)) = \begin{cases} \frac{1}{2}(y - f(x))^2 & \text{if } |y - f(x)| \leq \delta \\ \delta \left(|y - f(x)| - \frac{1}{2}\delta\right) & \text{if } |y - f(x)| > \delta \end{cases} $$ </pre>To improve the interpretability of the deep learning model, SHAP (Shapley Additive Explanations) values are used to estimate feature importance. SHAP provides insights into the contribution of each feature to the model's output by applying a game-theory-based approach to calculate contribution scores for each prediction. By analyzing SHAP values, operators can gain a better understanding of critical features influencing tunnel water levels, optimizing the operational decision-making process.
Algorithm: Multivariate Multistep LSTM with Huber Loss for Tunnel Water Level Forecasting and Anomaly Detection
Algorithm: Multivariate Multistep LSTM with Huber Loss for Tunnel Water Level Forecasting with Anomaly Detection
Input: Multivariate time series data $X$, LSTM model parameters, prediction horizon $H$, anomaly threshold $T$
Output: Forecasted water levels and anomaly labels
- Split $X$ into training ($X_{\text{train}}$) and testing ($X_{\text{test}}$) datasets \STATE Train the LSTM model on the training dataset using Huber loss \STATE Initialize model parameters and hyperparameters: $\Theta = \{\theta_1, \theta_2, \ldots, \theta_n\}$ \STATE \textbf{Training Phase:} \FOR{$i$ in $\text{number of epochs}$} \FOR{$j$ in $\text{mini-batches}$ of training data} \STATE Forward pass: Encode and decode the data, $\hat{X} = \text{LSTM}(\text{Encode}(X_{\text{batch}}, \Theta), \Theta)$ \STATE Calculate Huber loss for $H$-step ahead predictions: $L_{\text{Huber}} = \text{HuberLoss}(X_{\text{batch}}, \hat{X}, \delta)$ \STATE Backpropagation: Update model weights to minimize Huber loss, $\Theta \leftarrow \Theta - \eta \nabla L_{\text{Huber}}$ \ENDFOR \ENDFOR \STATE \textbf{Testing Phase:} \FOR{$k$ in $\text{mini-batches}$ of testing data} \STATE Forward pass: Encode and decode the data, $\hat{X} = \text{LSTM}(\text{Encode}(X_{\text{batch}}, \Theta), \Theta)$ \STATE Calculate Huber loss for $H$-step ahead predictions for each sample: $L_{\text{sample}} = \text{HuberLoss}(X_{\text{batch}}, \hat{X}, \delta)$ \IF{$L_{\text{sample}} > T$} \STATE Mark as an anomaly \ELSE \STATE Mark as normal \ENDIF \ENDFOR \RETURN Forecasted water levels and anomaly labels \end{algorithmic} \end{minipage} } \end{algorithm} \end{code> </pre>
The use of SHAP values helps to explain the model's predictions by highlighting the contribution of different features. For example, this approach enables water utility operators to make informed decisions on when to activate pumps to prevent tunnel overflow based on critical feature importance.