Commodity production is tightly coupled with macro shocks—trade wars, pandemics, market crashes, and extreme weather. DeepAg builds an outlier-aware pipeline: (1) detect rare events in financial indices using Isolation Forests after double-rolling normalization, (2) learn causal/correlated pairings between indices and commodities, and (3) forecast production with an LSTM that explicitly includes outlier flags. Across 15 commodities, outlier-aware DeepAg improves RMSE over baselines and the same LSTM without outlier inputs; isolation-aware models capture shock-driven surges that classical regression misses.
Deep Learning
Isolation Forest
Agriculture
Outlier Events
DeepAg: Outlier-Aware Agricultural Forecasting
DeepAg fuses isolation-forest outlier detection with LSTM forecasting to quantify how financial shocks, weather, and political events reshape agricultural production. The framework couples causation/correlation screening with multi-step multivariate forecasts, delivering scenario-aware production guidance.
Abstract
Research Questions
- Do macro outlier events (economic, financial, weather, political) materially change agricultural production forecasts?
- Can an LSTM conditioned on detected outliers outperform regression and tree baselines on multi-step commodity production?
- Which financial indices causally drive each commodity, and how does causation differ from correlation?
Data & Context
Financial indices (Yahoo Finance, 2000–2019): Gold, Crude Oil, DOW, S&P 500, VIX (daily close).
Commodities (USDA NASS QuickStats, monthly): Beef, Butter, Cheese, Chickens, Ducks, Eggs, Ice Cream, Lamb/Mutton, Milk, Other Poultry, Pork, Sherbet, Turkeys, Veal, Water Ices.
Outlier events: detected over indices; mapped to economic, financial, weather, or political shocks.
| Index | Contamination (%) |
|---|---|
| VIX | 6.56 |
| S&P 500 | 6.01 |
| DOW | 6.13 |
| Gold | 5.38 |
| Crude Oil | 3.95 |
Method
Pipeline
- Normalize indices with DoubleRollingAggregate; flag anomalies via Isolation Forest.
- Compute causation (DoWhy) and correlation to select driver indices per commodity.
- Train multivariate LSTM (lookback 60, forecast ≈30 monthly steps ≈5 years) with and without outlier flags.
- Compare against regression, trees, and boosting baselines.
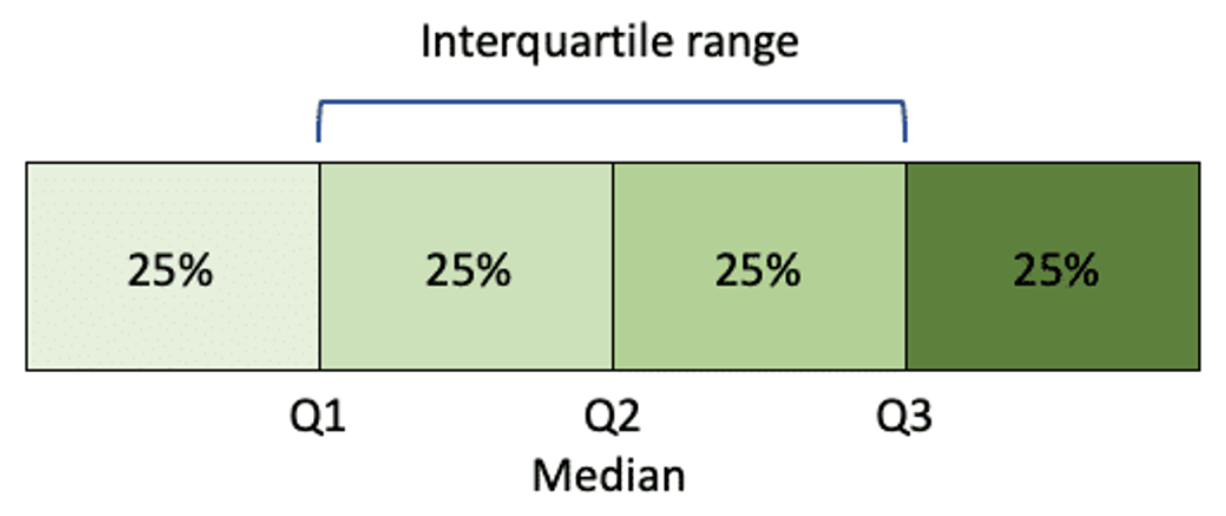
Hyperparameters: MinMax scaling; contamination from IQR; multi-step horizon; RMS-based evaluation.
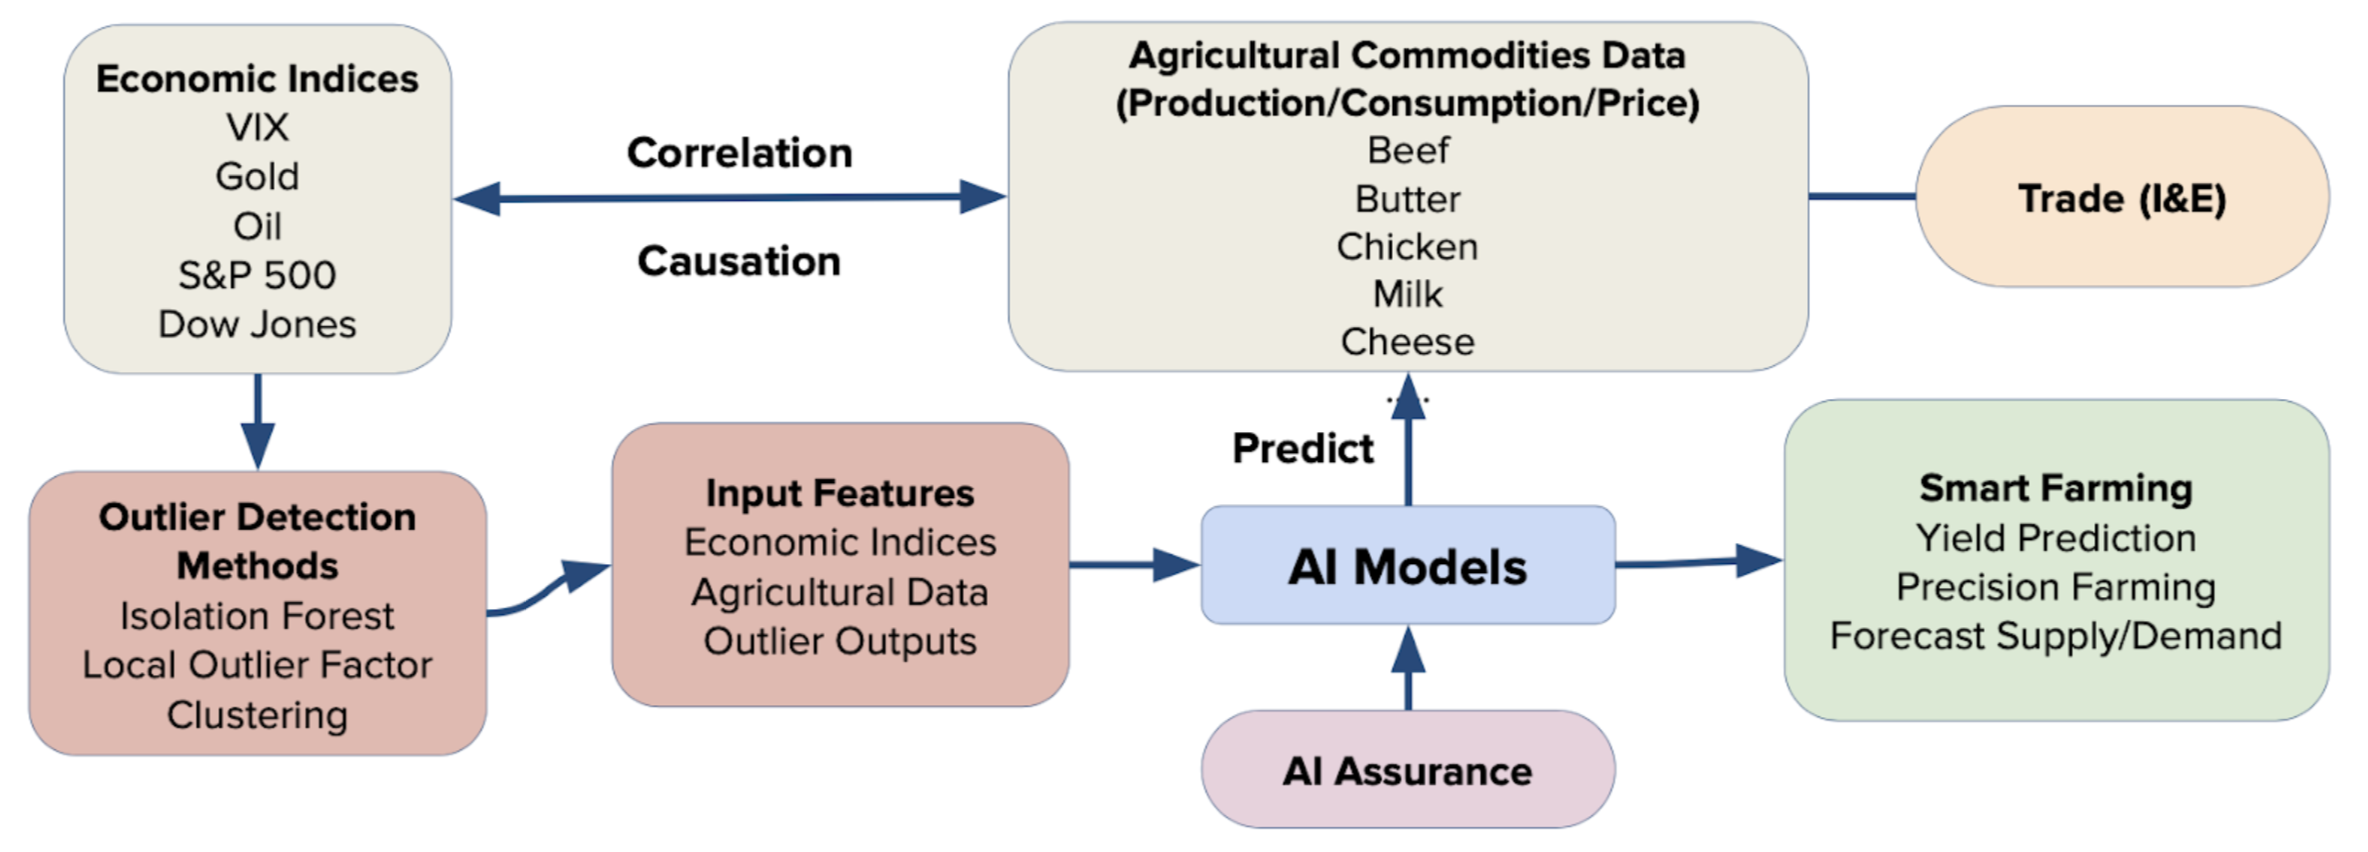
Two-stage flow: anomaly detection on indices → causal screening → LSTM forecasting with outlier inputs.
Outlier Detection
Isolation Forest isolates rare partitions quickly; contamination is set from interquartile spread. Outlier flags are fed to the LSTM as an input feature so the forecaster can reshape trajectories during shocks.
DoubleRollingAggregate scales S&P 500; anomalies become separable.
Red markers: detected outliers aligned with trade wars, recessions, and major shocks.
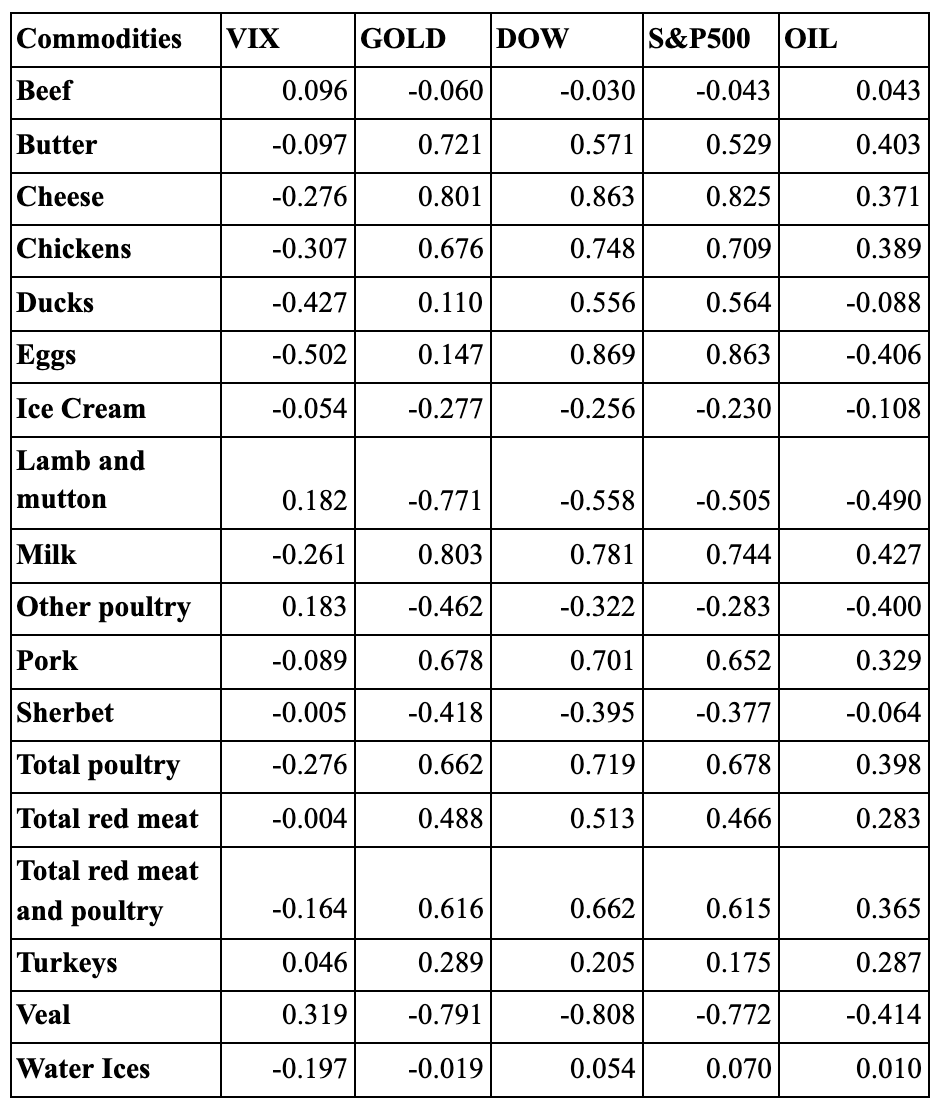
Causation vs Correlation
DoWhy causation scores often diverge from raw correlations. Meat and dairy show strong causation from DOW/S&P; VIX exhibits weaker influence. DeepAg pairs each commodity with its top causal and correlated index before forecasting.
Causation matrix: DOW and S&P are dominant drivers for many commodities.
Correlation vs causation for chicken production and DOW.
Results
15/15Commodities evaluated
Lower RMSEOutlier-aware vs baselines on 12/15
5 yrsMulti-step horizon
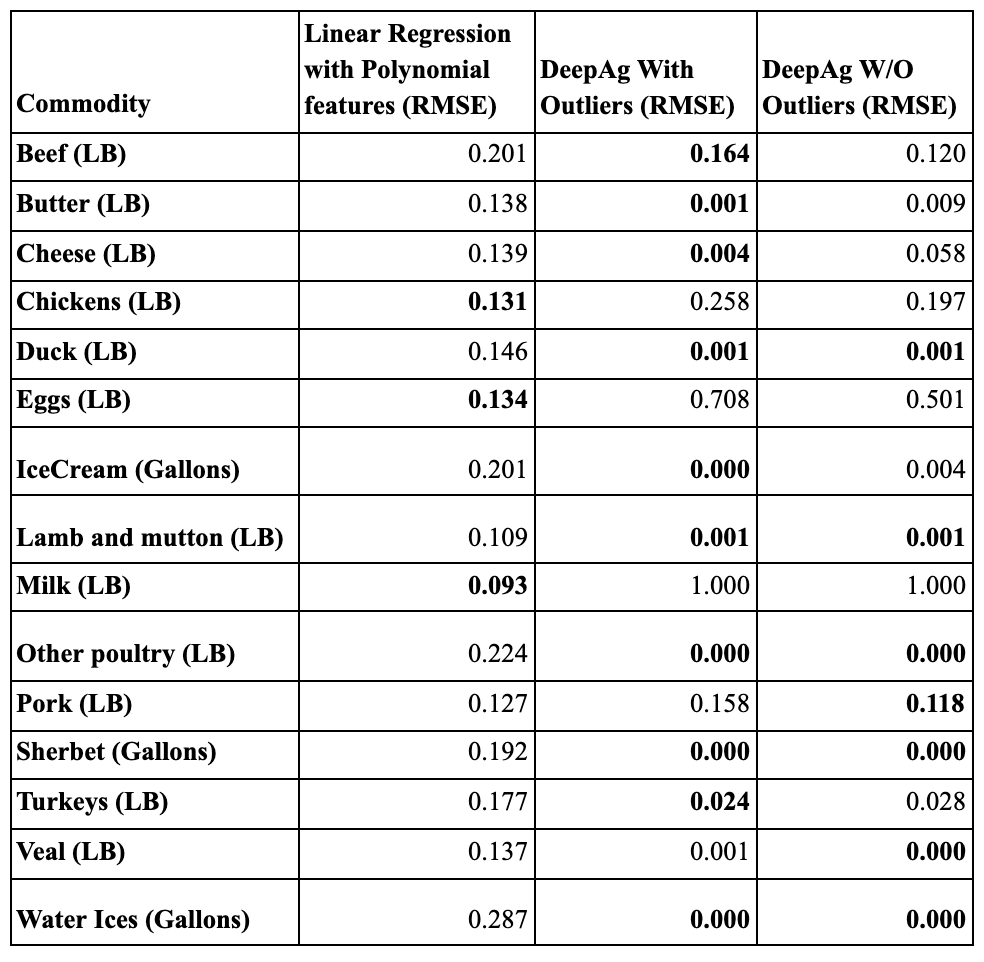
| Commodity | Best baseline | DeepAg (with outliers) | DeepAg (no outliers) |
|---|---|---|---|
| Butter | 0.138 (Poly Reg) | 0.001 | 0.009 |
| Cheese | 0.139 (Poly Reg) | 0.004 | 0.058 |
| Beef | 0.201 (Poly Reg) | 0.164 | 0.120 |
| Chickens | 0.131 (Poly Reg) | 0.258 | 0.197 |
| Turkeys | 0.177 (Poly Reg) | 0.024 | 0.028 |
Outlier-aware LSTM improves most commodities; a few steadily trending series (e.g., chickens) remain competitive for linear regressions.
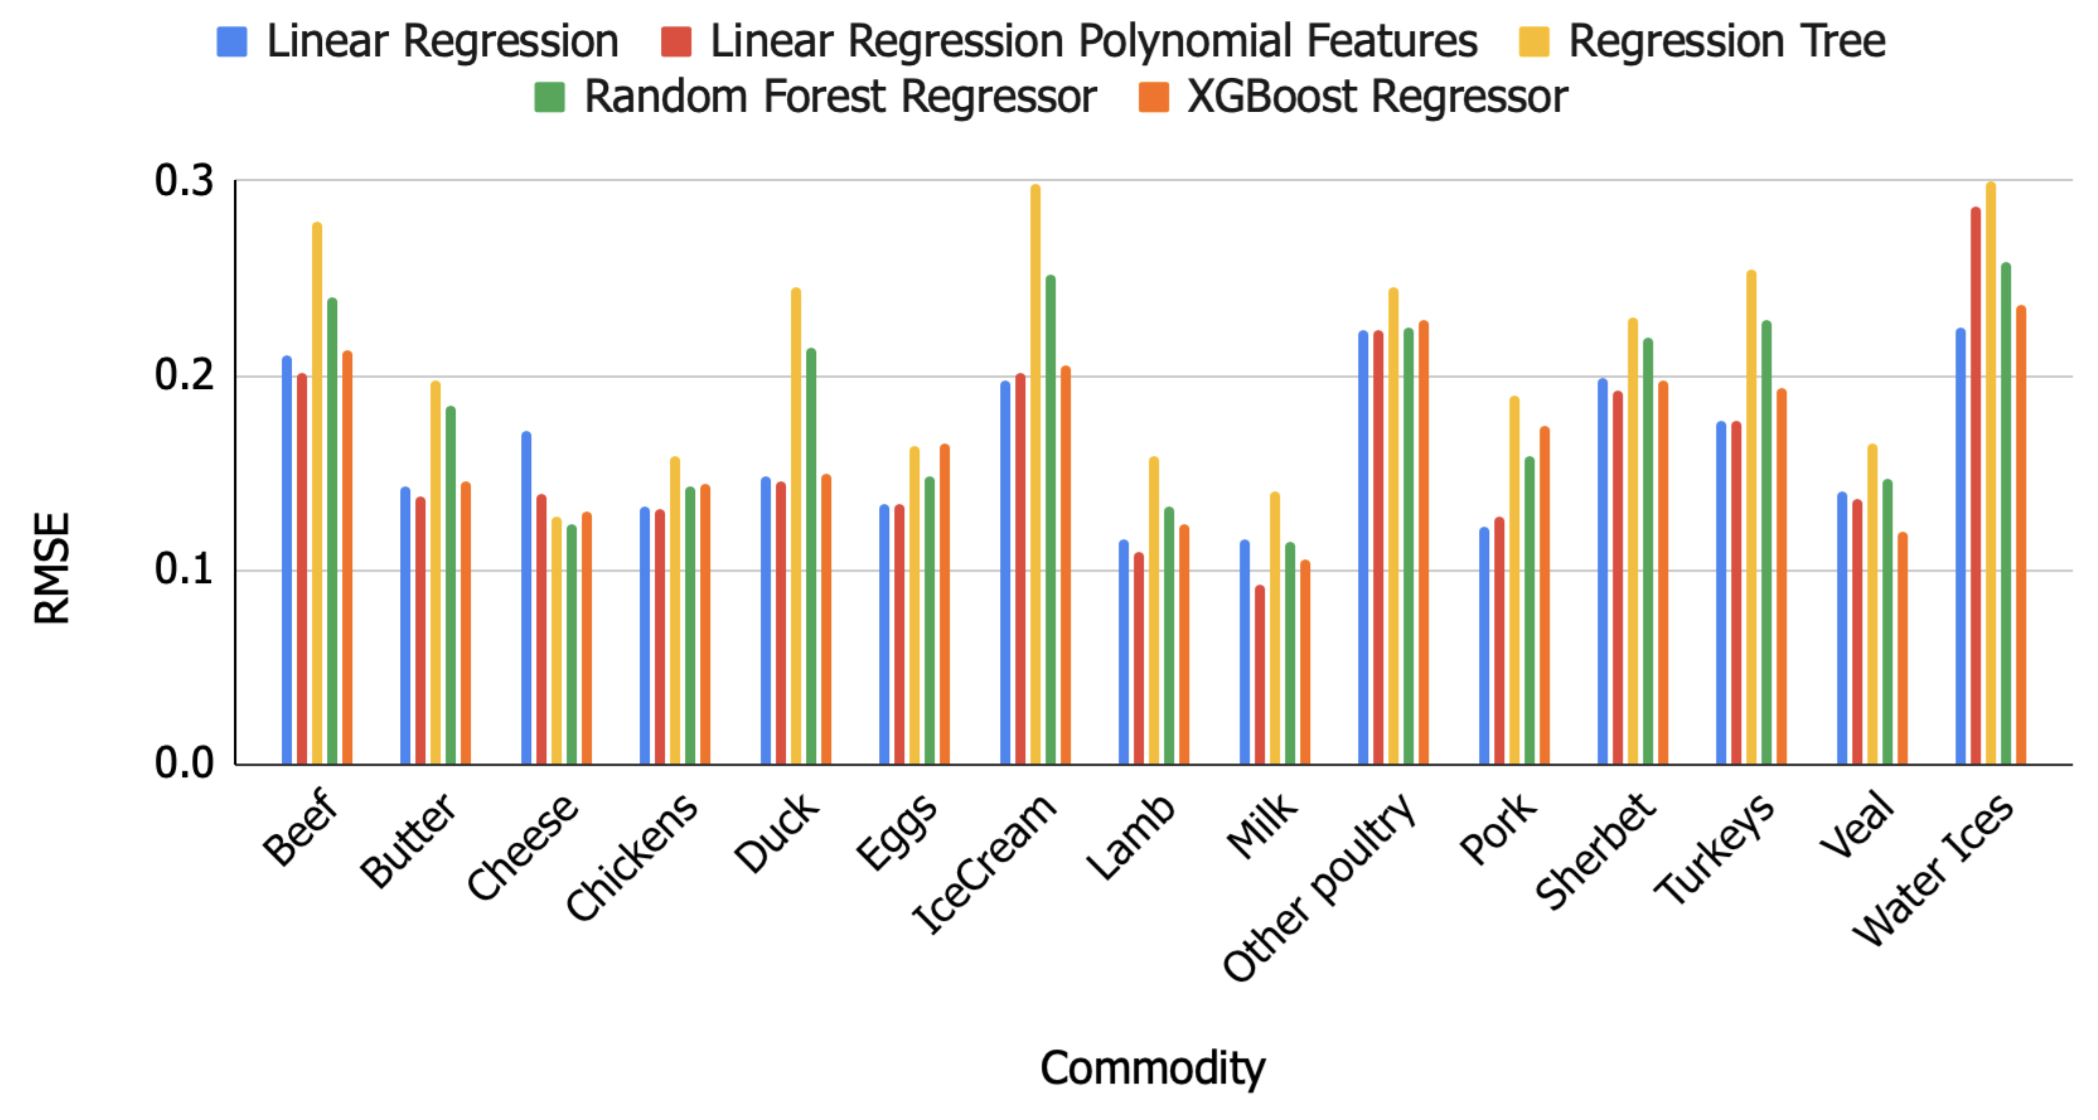
Baseline RMSE across models.
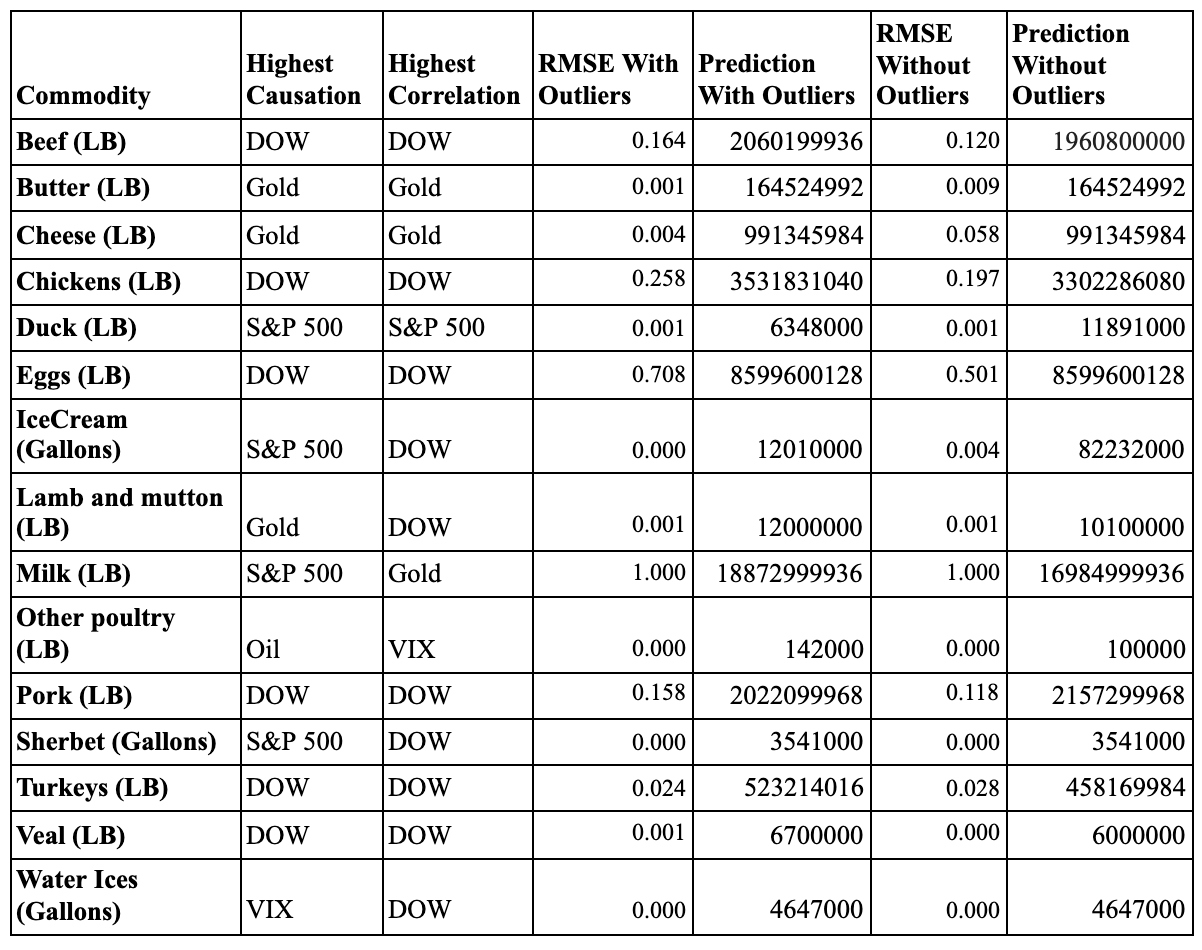
DeepAg forecasts with/without outliers across 15 commodities.
Forecast Examples

Chicken production 2020–2025 with and without outlier inputs.
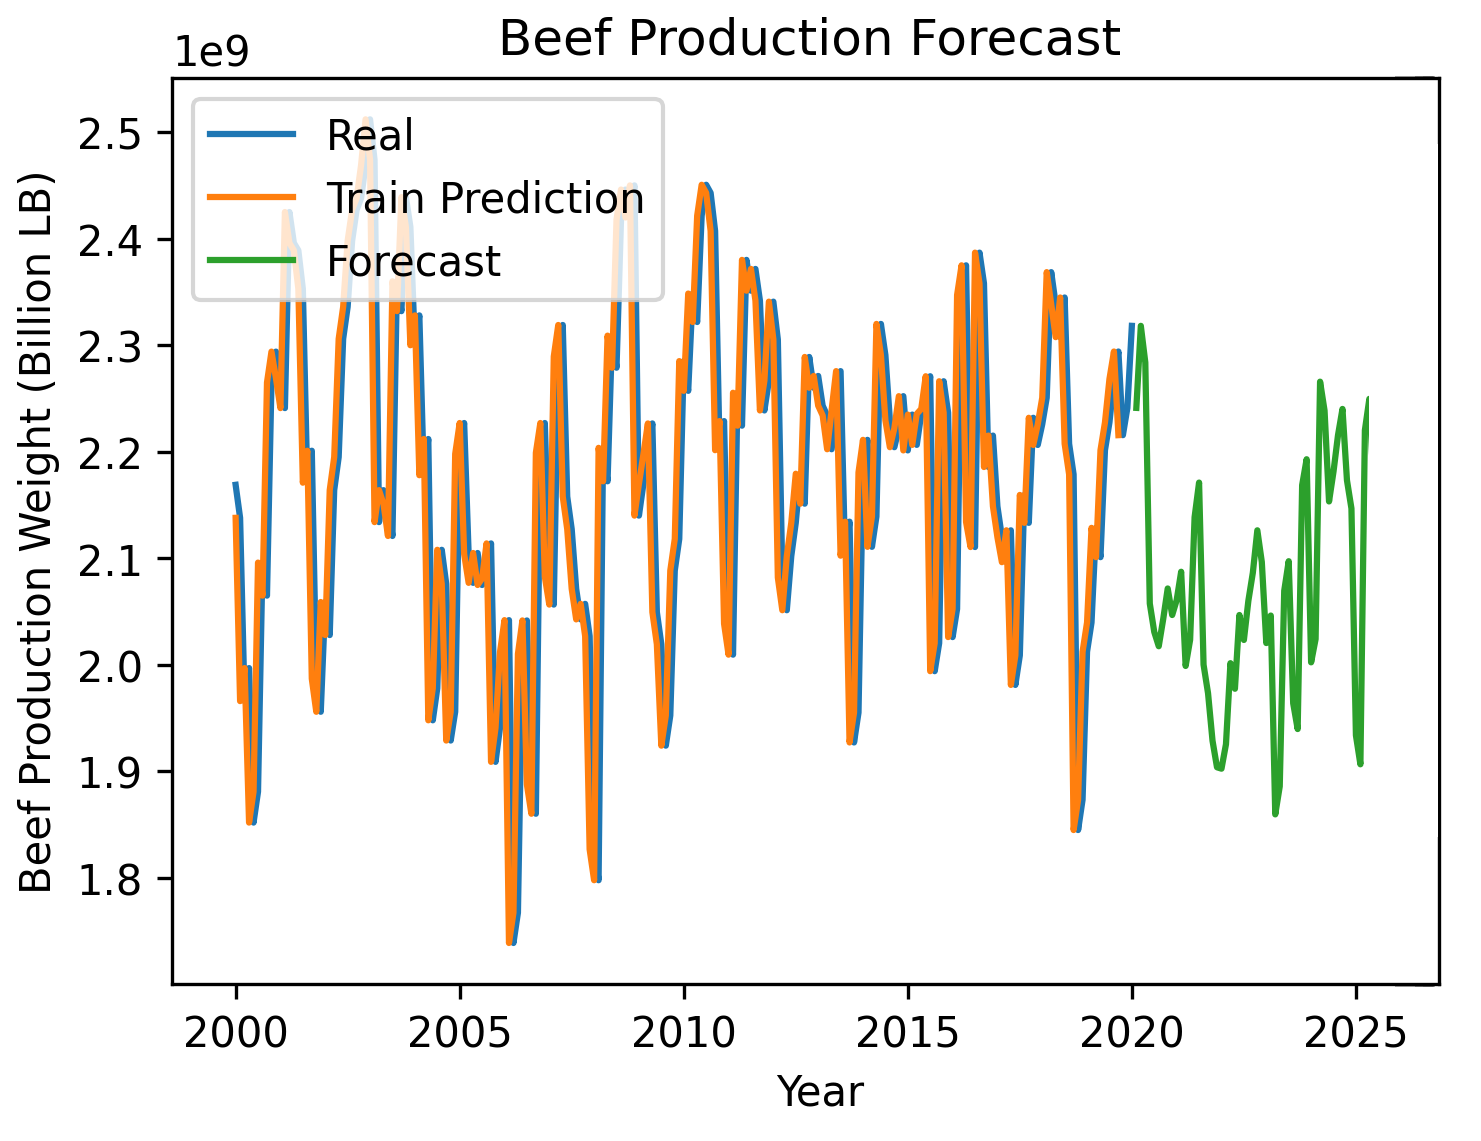
Beef production forecast; outlier-aware model captures shock-induced swings.
Policy & Operational Insights
- Outlier flags help quantify production shifts during trade wars, recessions, and natural disasters—useful for USDA/FAO policy scenarios.
- Producers can plan labor, inventory, and pricing around interval forecasts that condition on shocks.
- Better shock modeling mitigates food waste by smoothing release of supply during demand spikes.
Gallery